Kickoff.
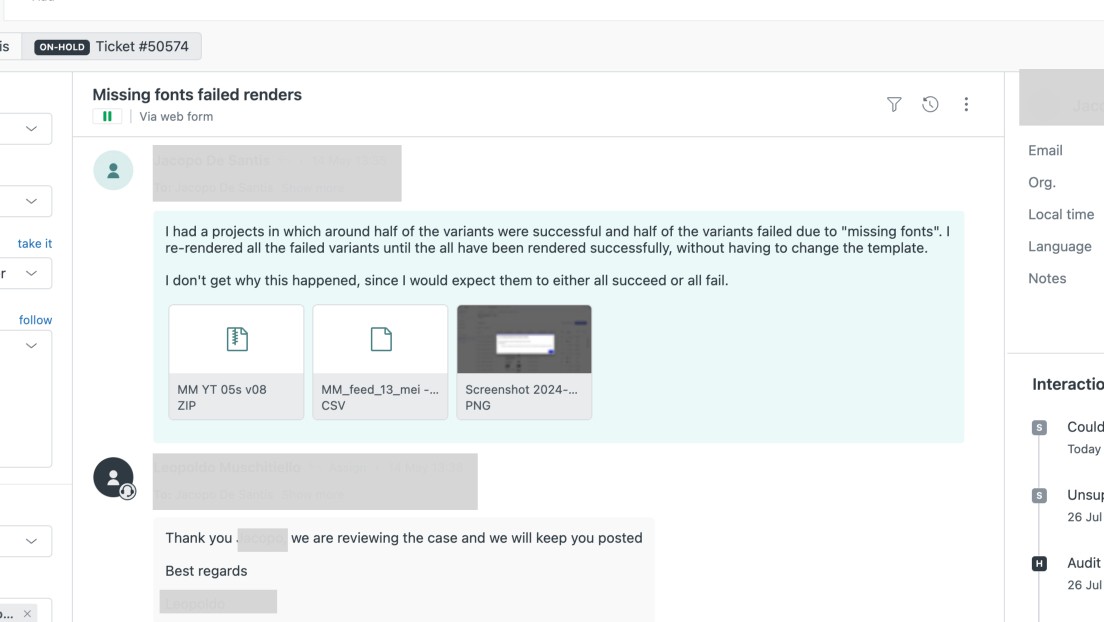
This initiative started after having a chat with the support team after I heard an agent talking about their frustrations of the day trying to help a user figure out why a video template they had made wasn't working. That was the spark that made me realise there were lots of issues coming to the support team that were not caused by bugs, but were being treated as one.
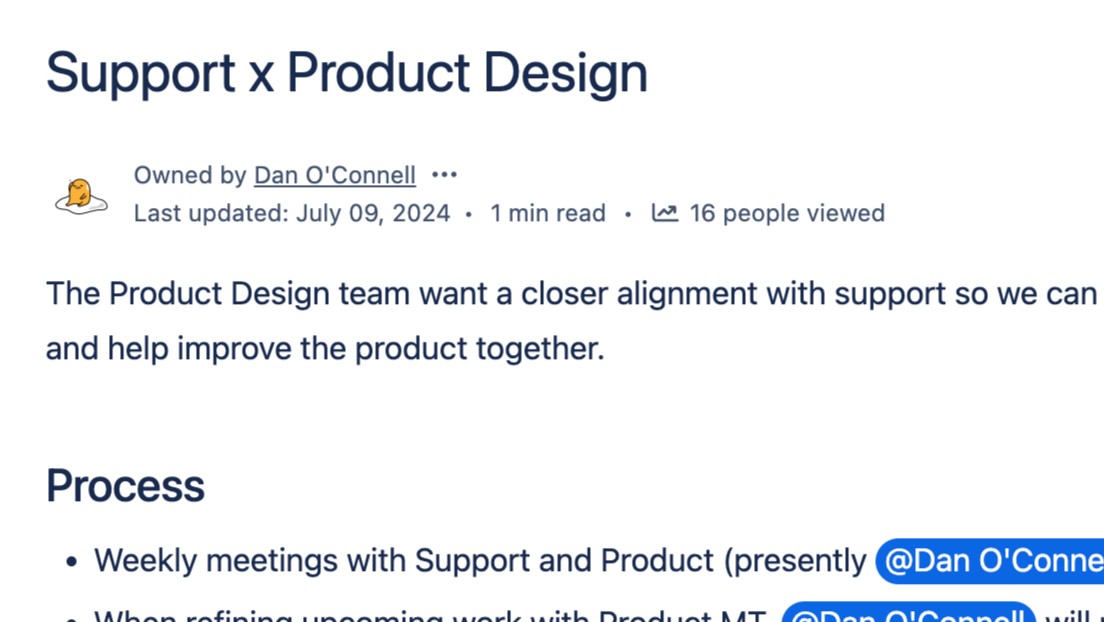
To address this gap in our process, I agreed with the support team lead to have weekly meetings with him, which involved a quick run-through of the support tickets during that period, where I documented design related issues to bring to the product design team.
This was initially scoped out of the MVP until checking with stakeholders, who raised the priority due to the potential sensitive nature of these types of mistake.
An evolving process.
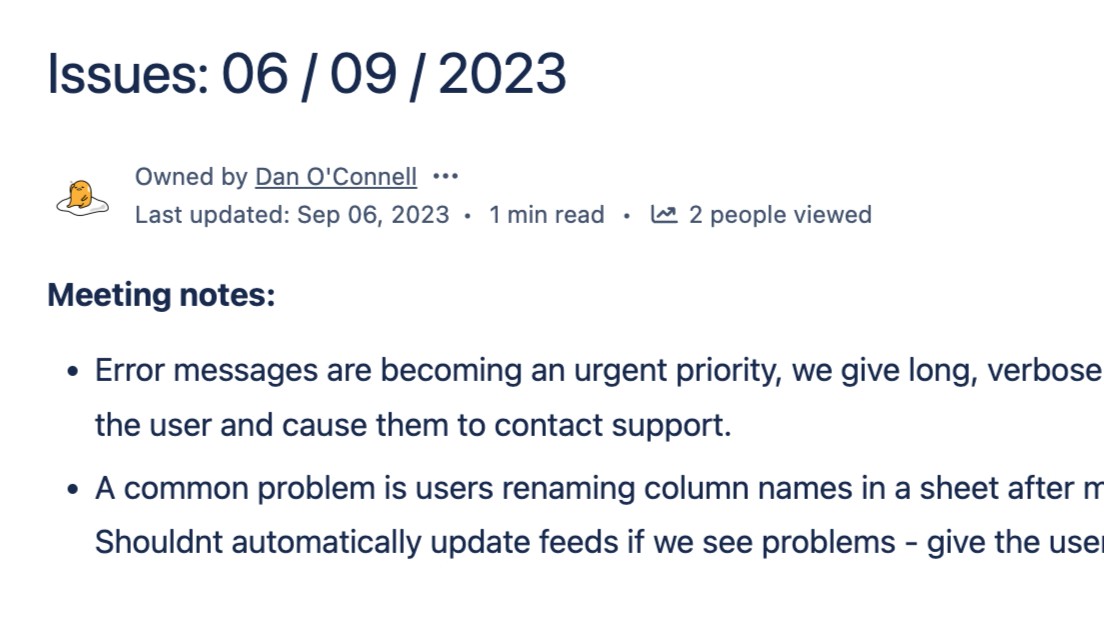
I started off by documenting the problems, linking them to the issues in Zendesk and creating Jira tickets for teams to pick up in their sprints. However this process was not very effective in getting any issues addressed. It also involved a lot of manual work and duplication of information
I wanted to cut down on the manual work and instead use Zendesk itself as the source the product team can pull from.
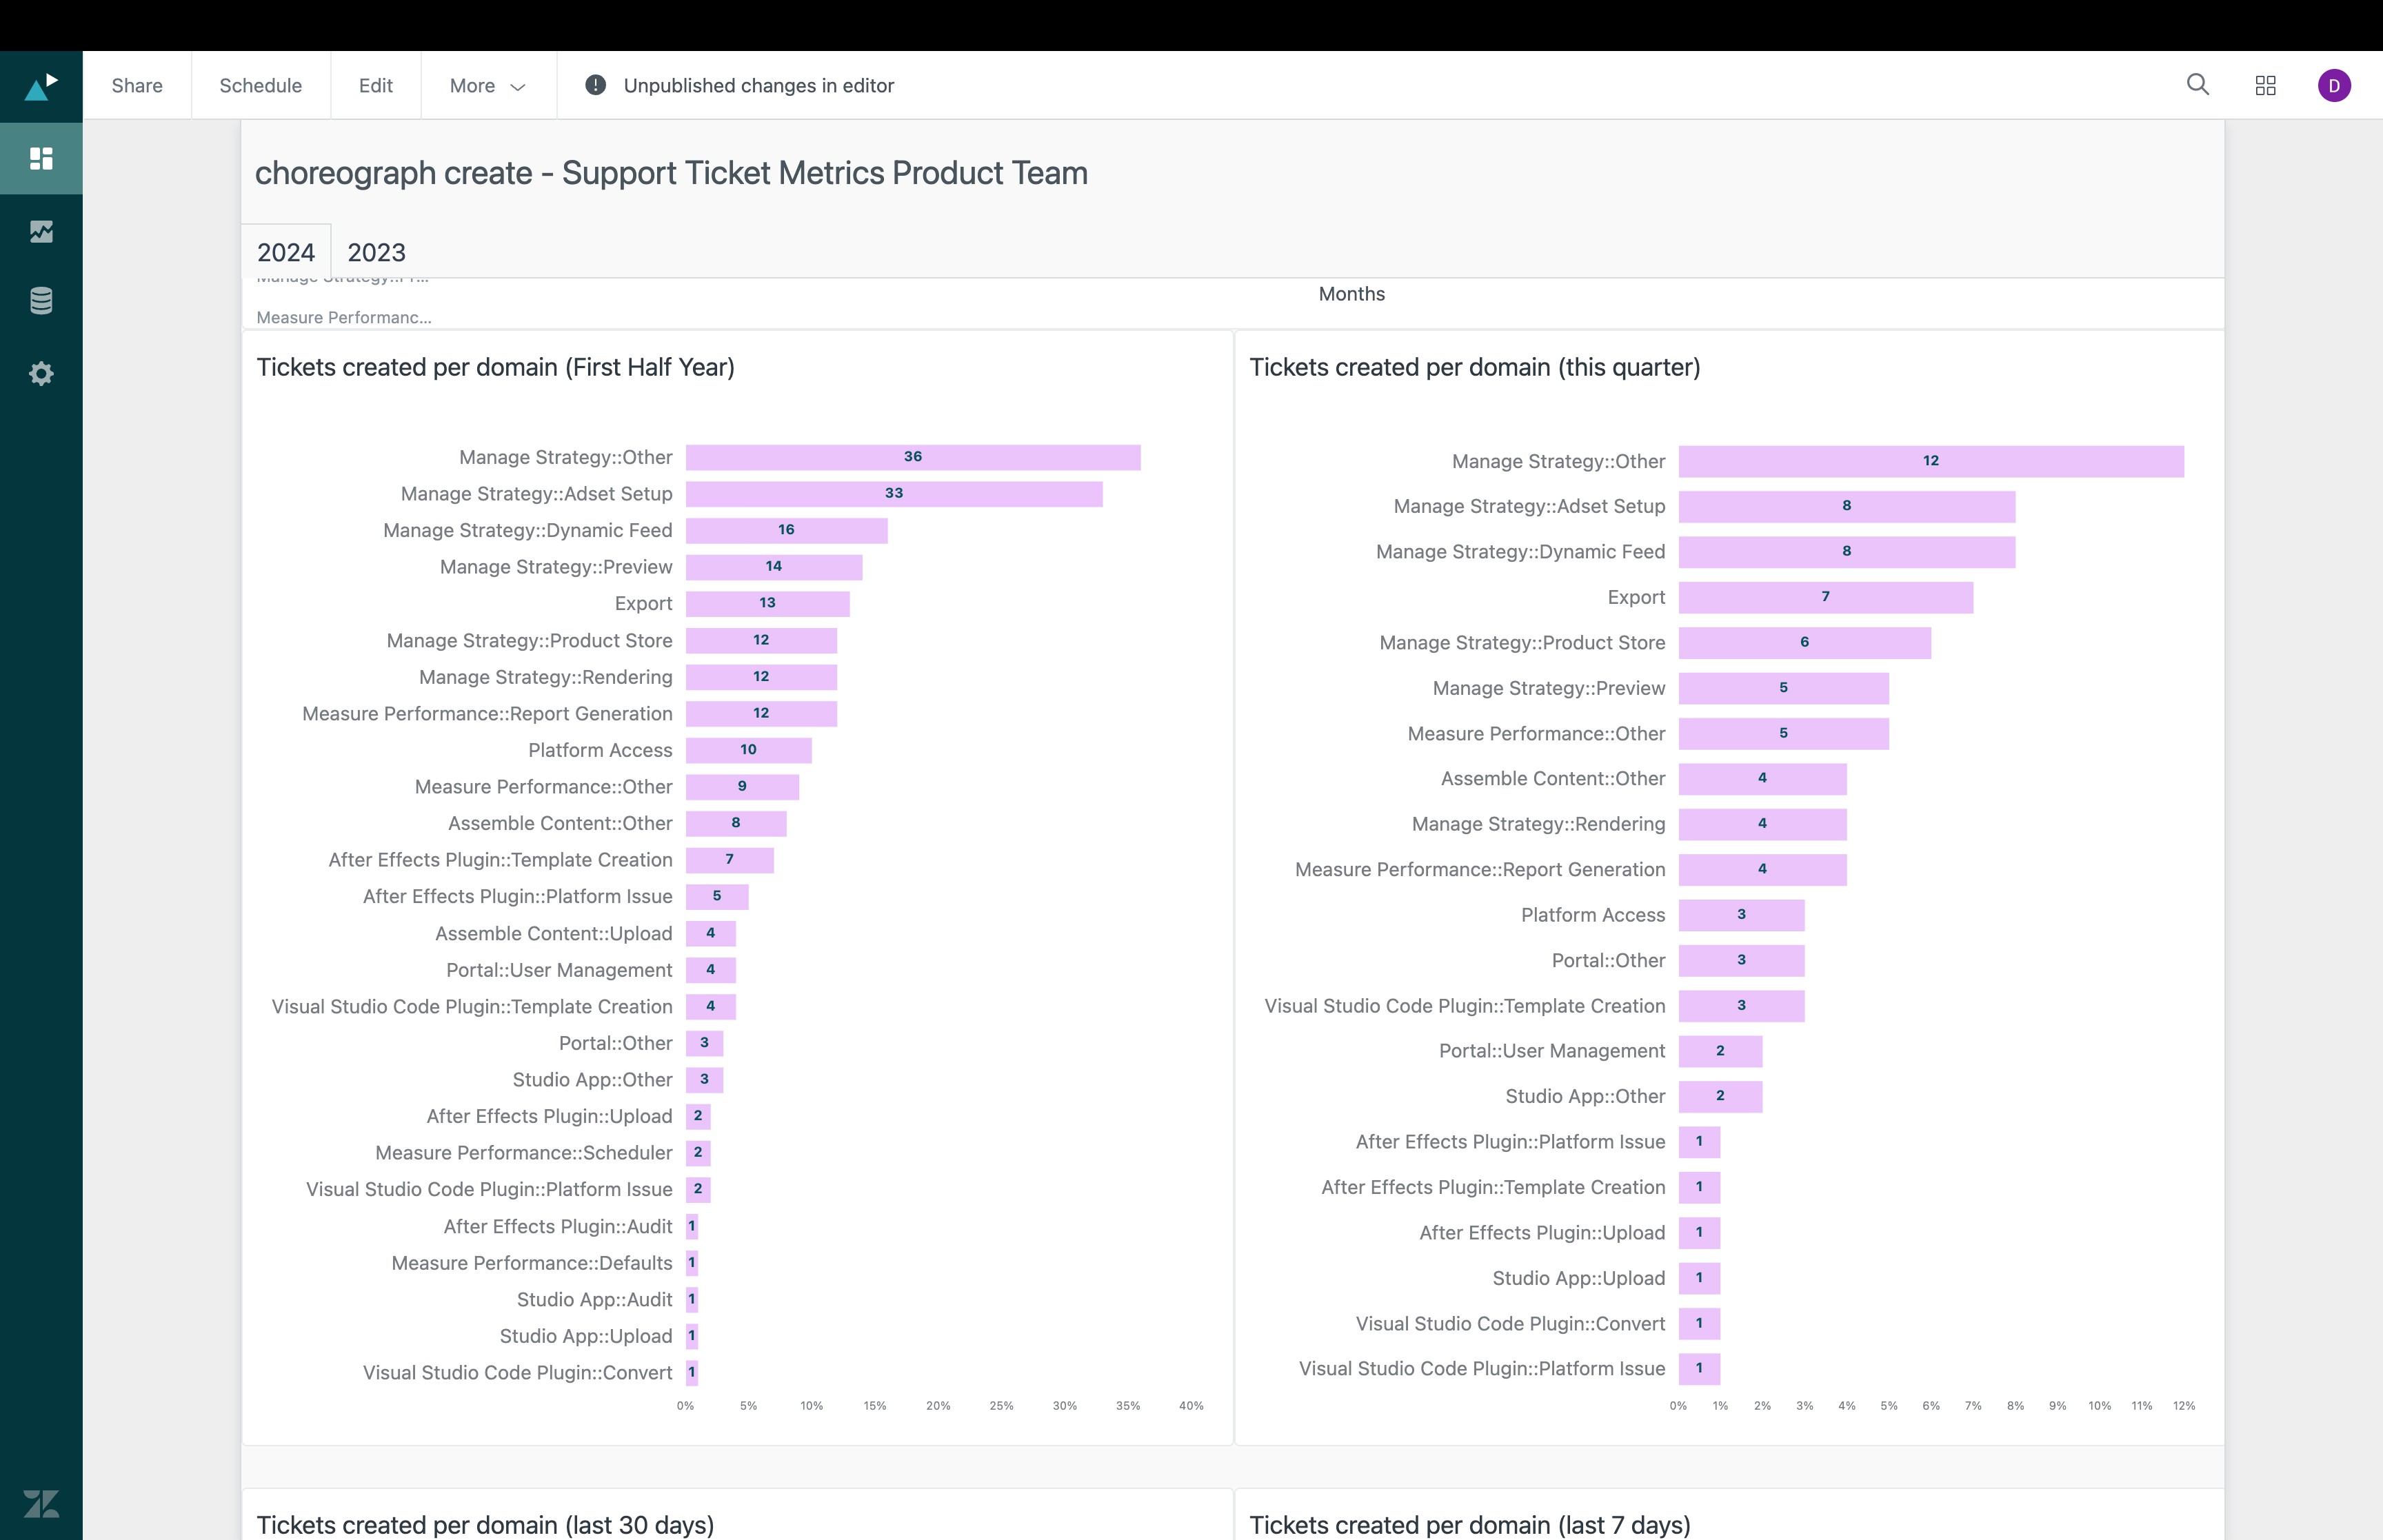
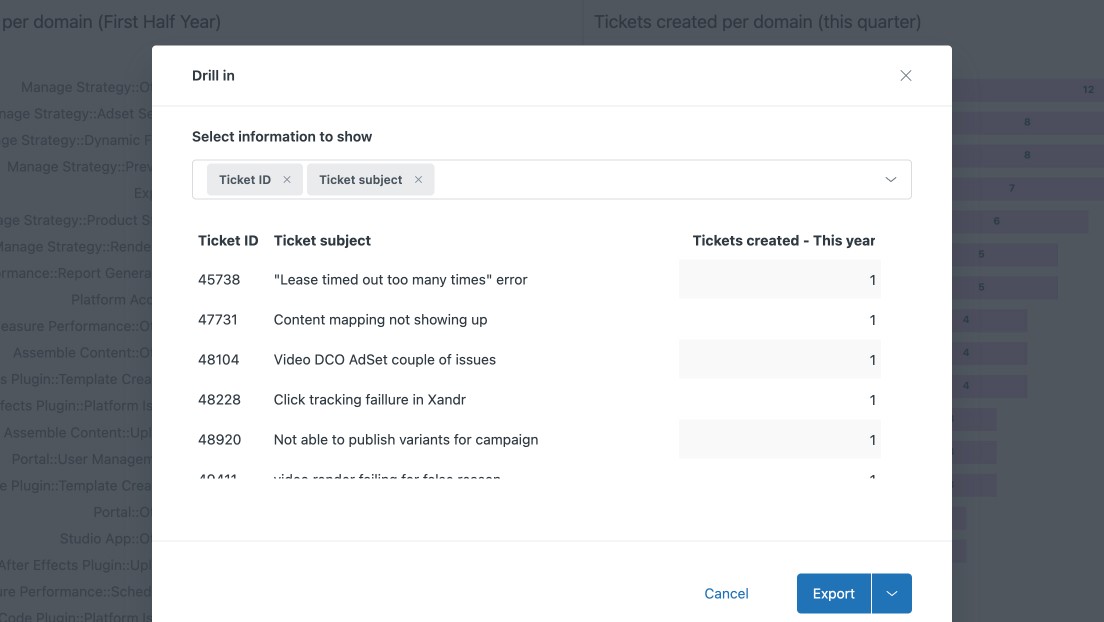
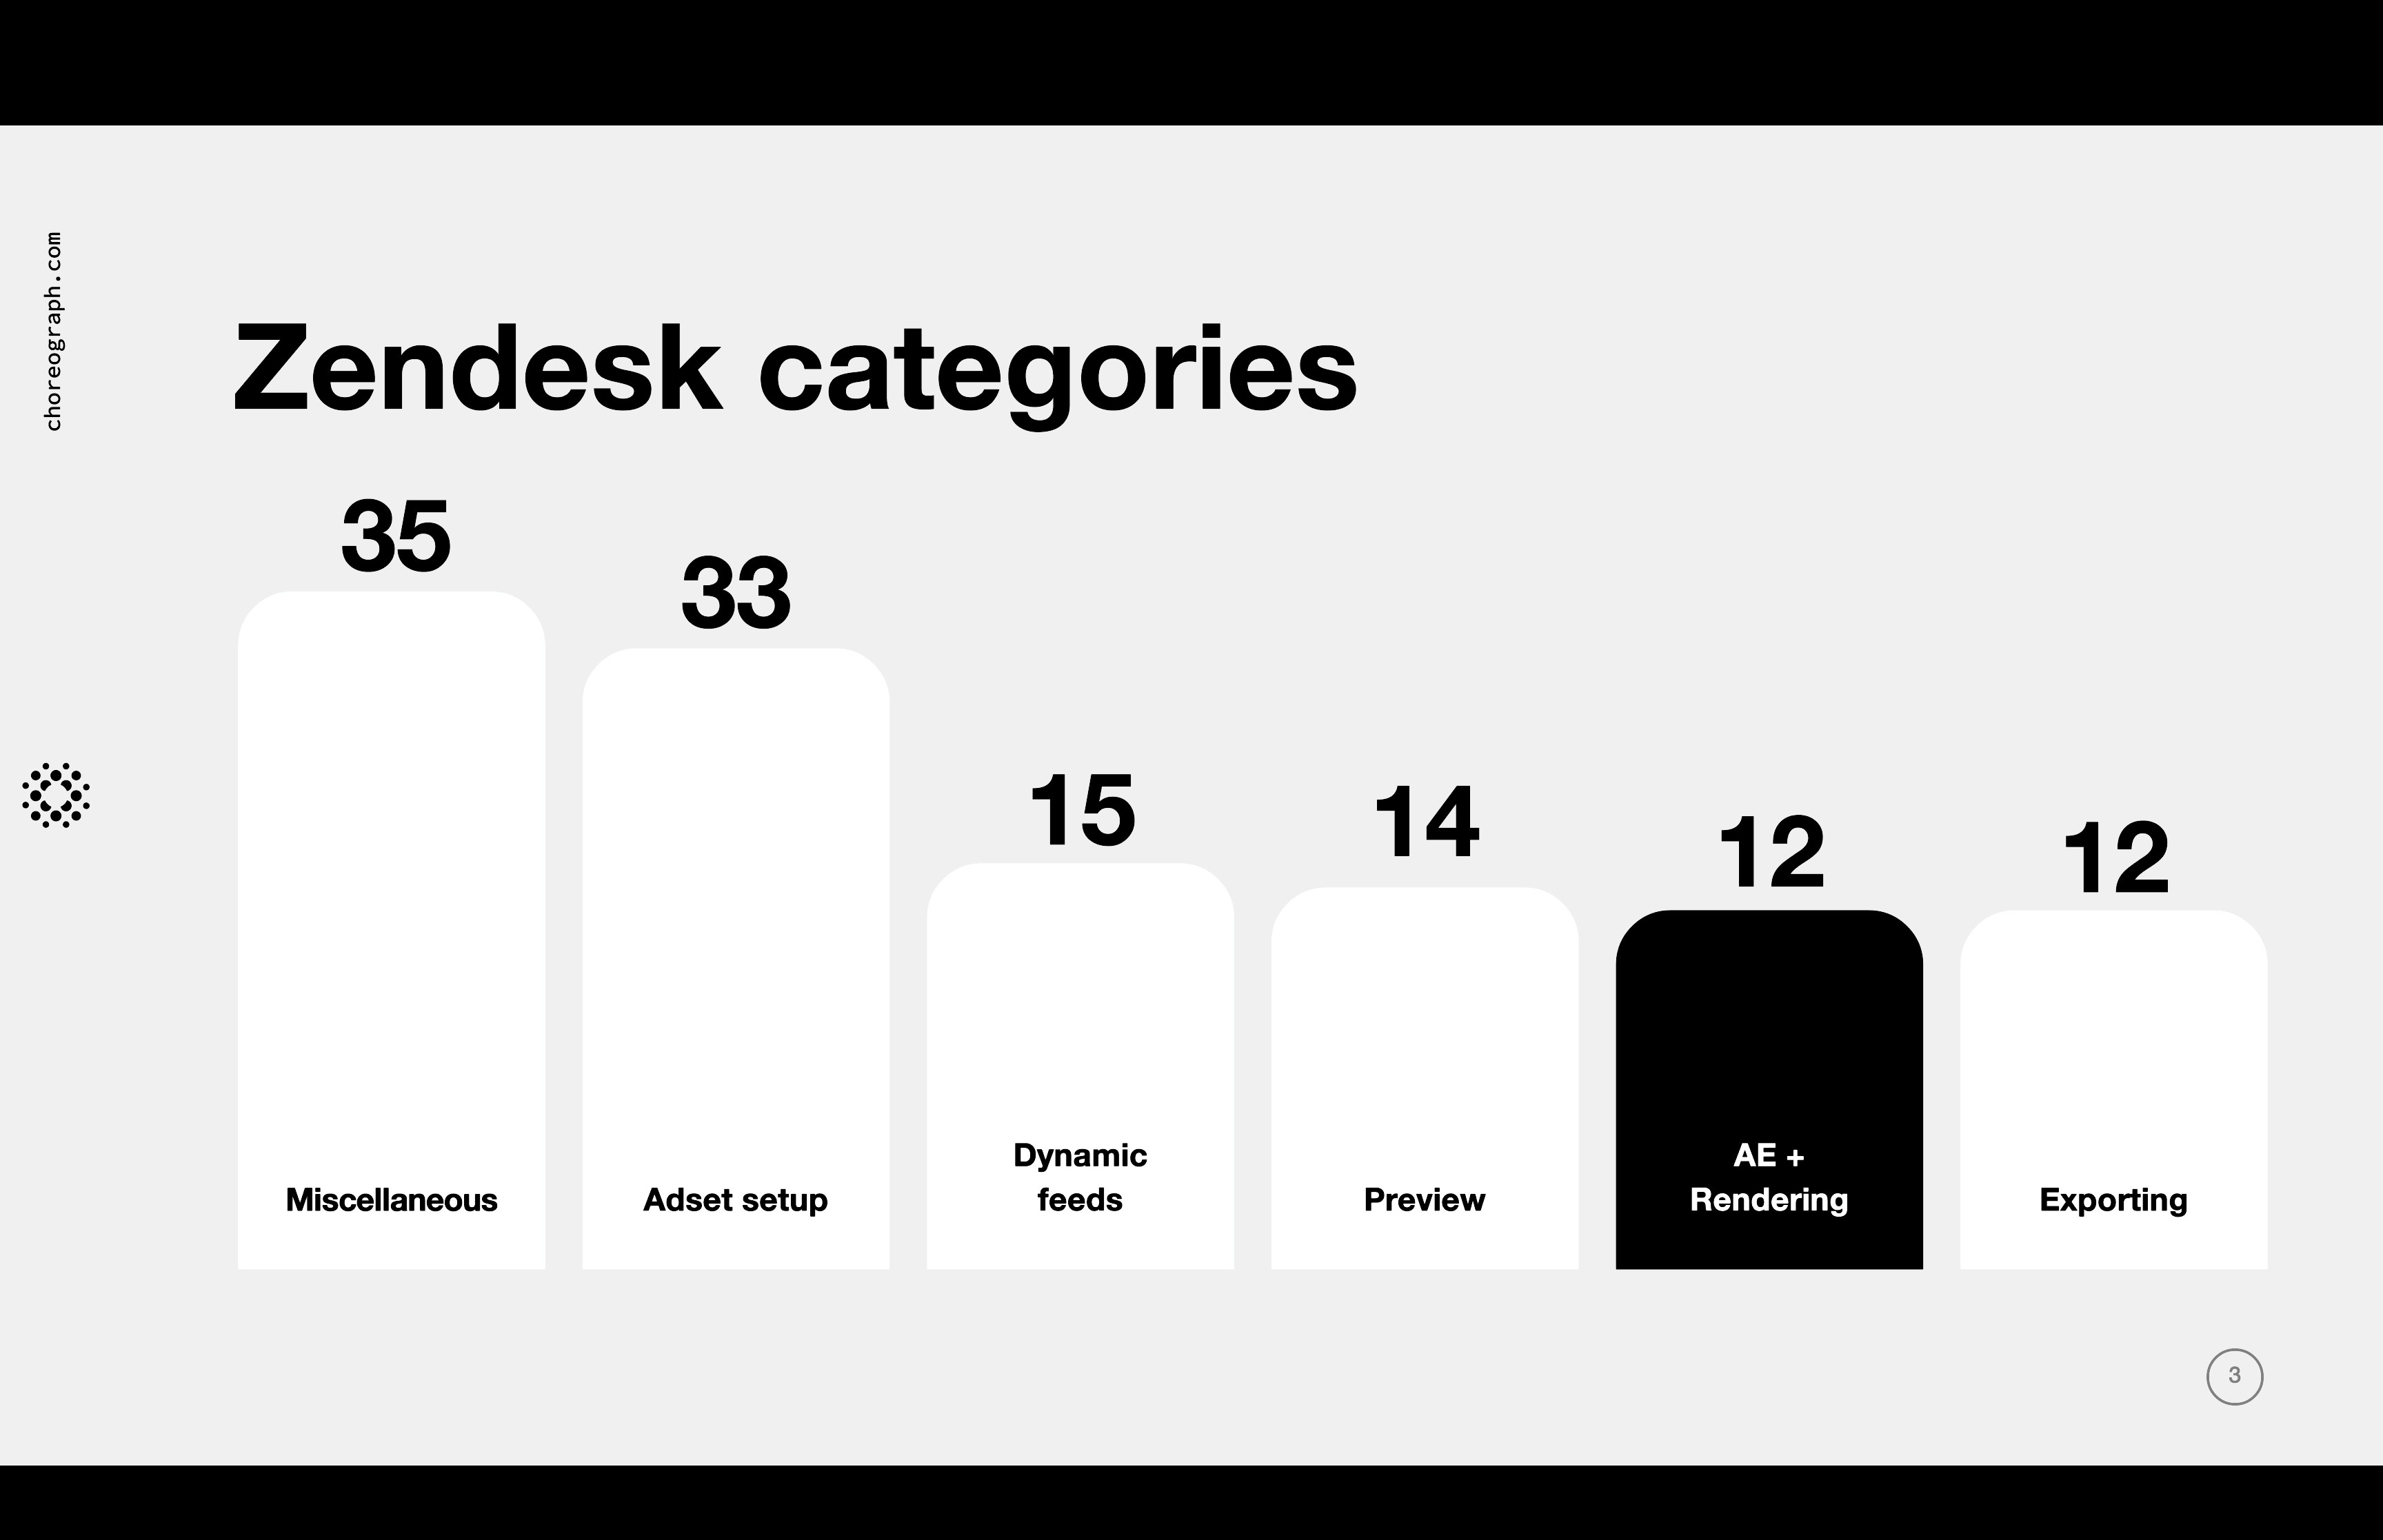
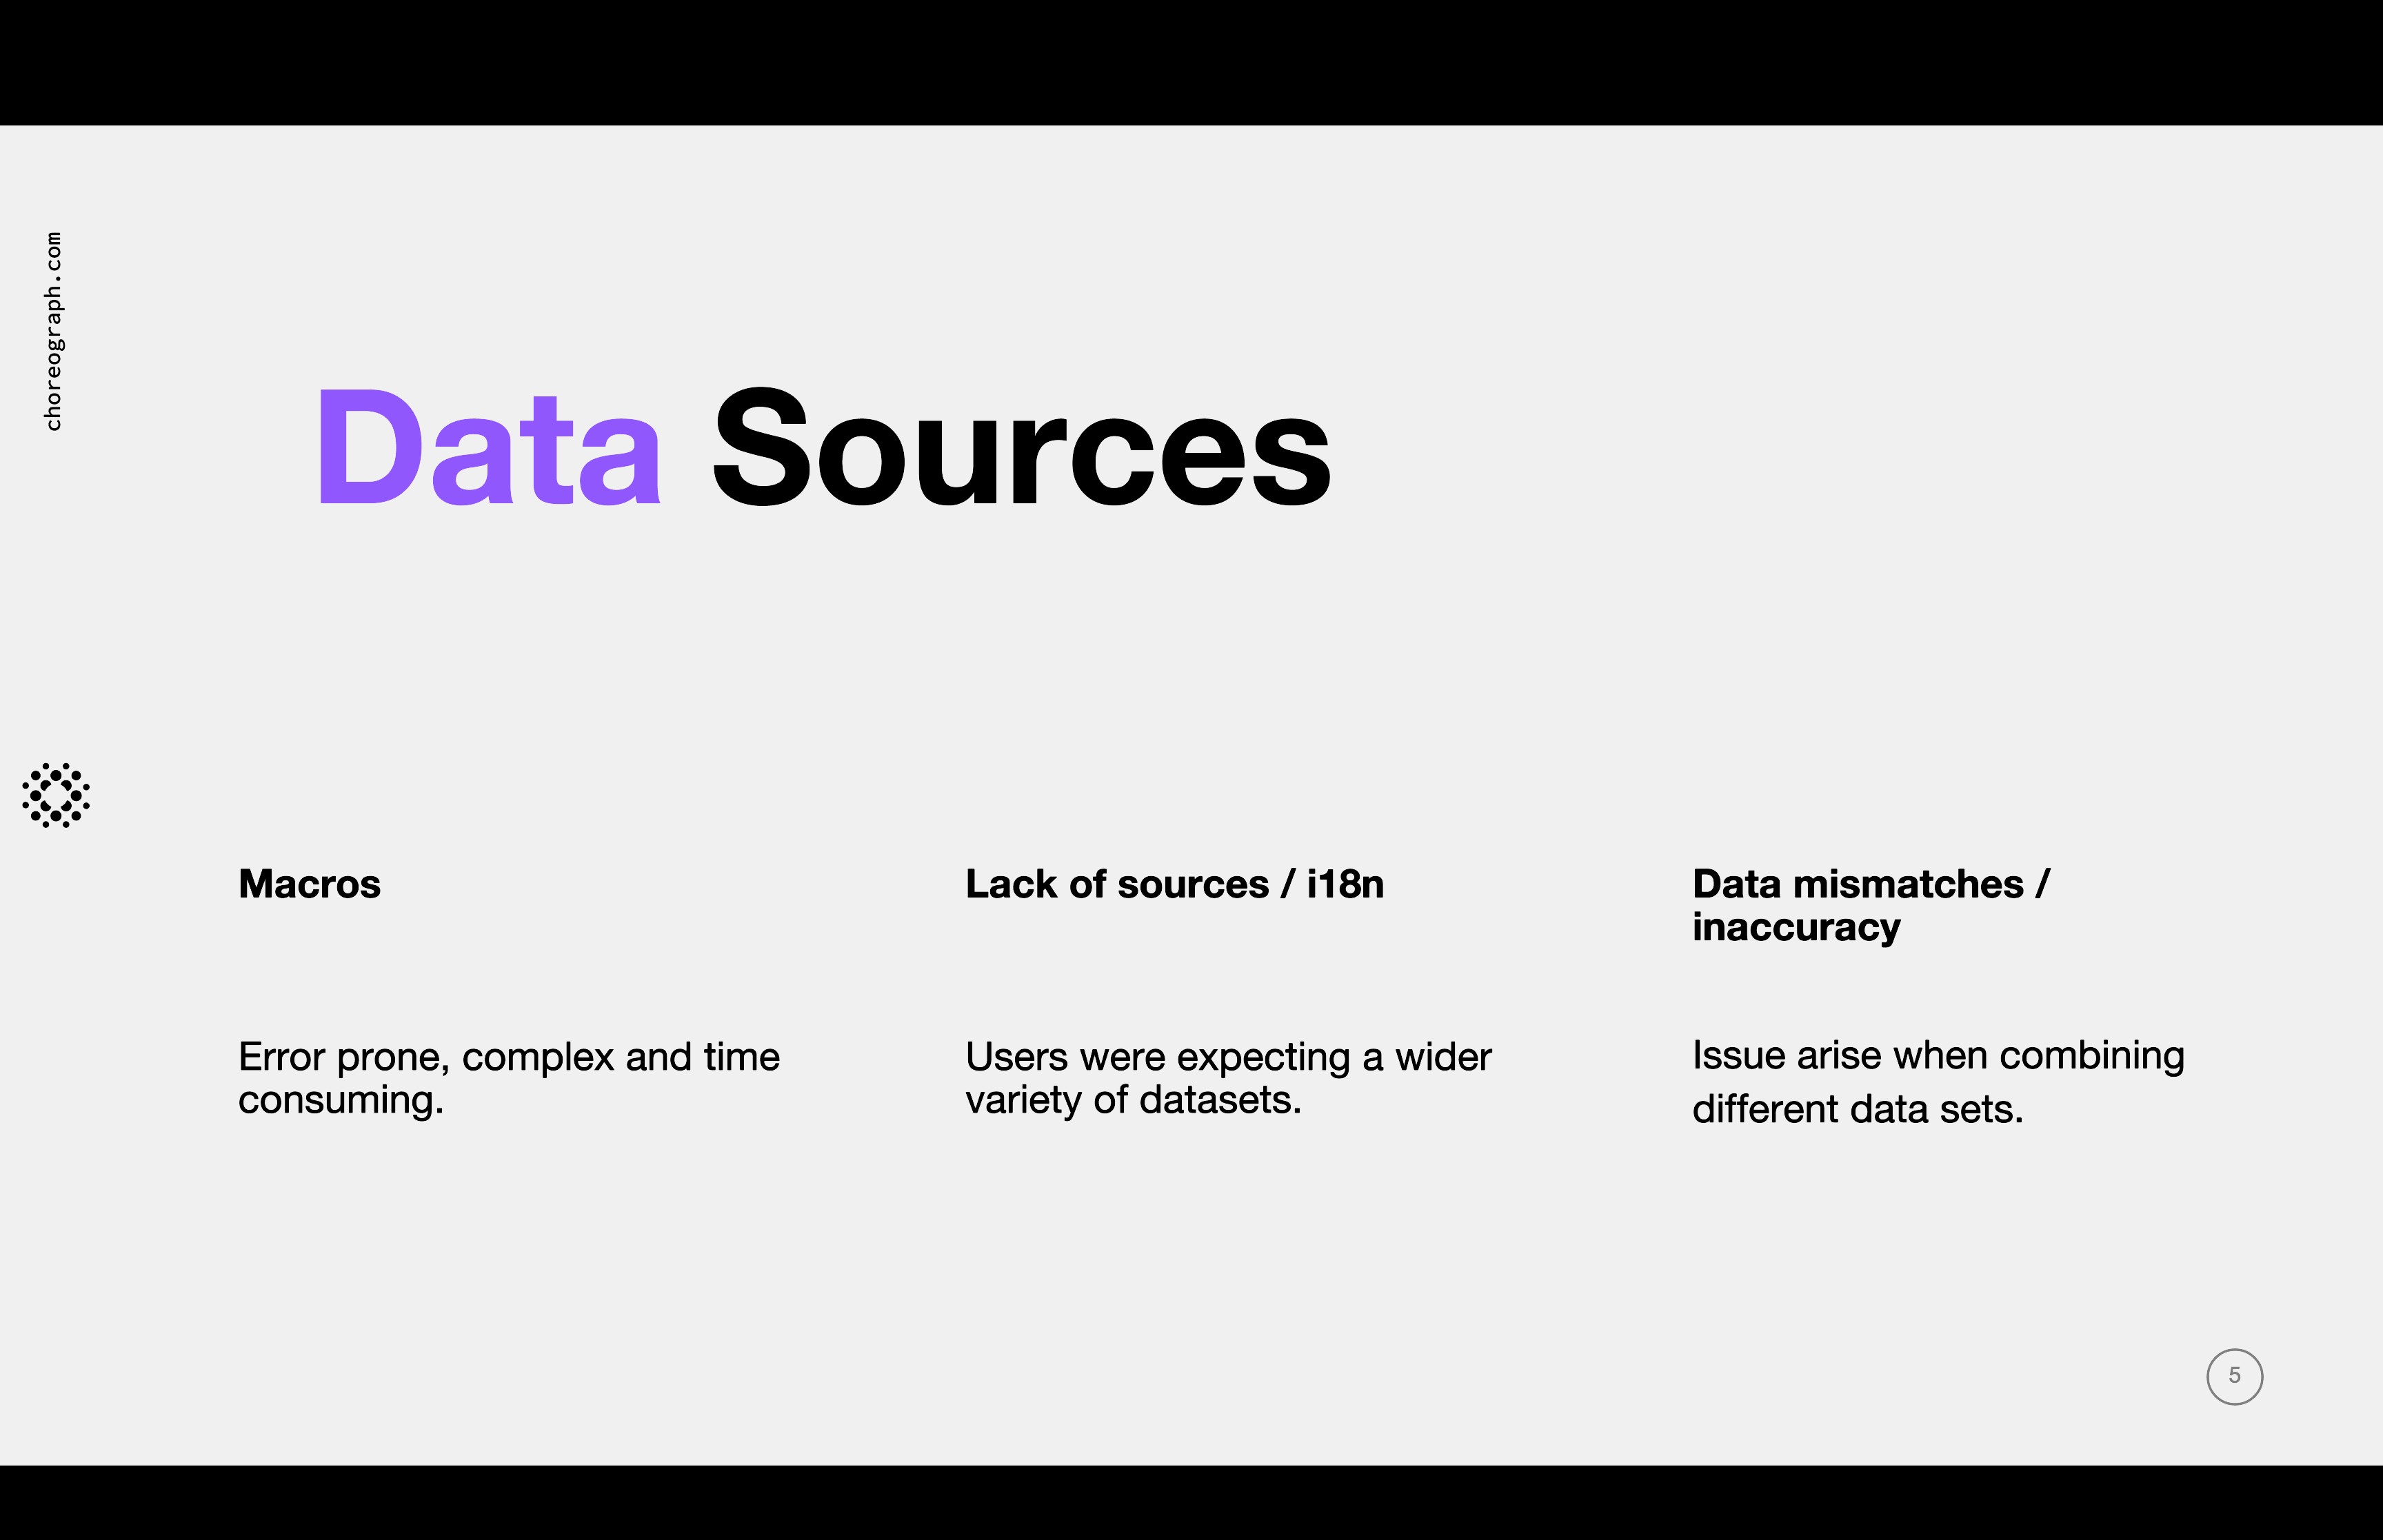
To do this, we had an exercise where we grouped issues from the past 2 quarters into appropriate categories as best as possible. The support team were then trained to add the correct labels to each Zendesk issue, which we could leverage to group and present data in a tangible format, as seen in the below screenshots.
This was initially scoped out of the MVP until checking with stakeholders, who raised the priority due to the potential sensitive nature of these types of mistake.
Transparency via dashboarding.
The next step was to make the data accessible to everyone. The support lead created the dashboard inside of Zendesk itself and the link is shared with the entire product team so they can dive into the data whenever they need to.
The dashboard has a double role as we can use it to measure the impact the initiative has via comparing categories over time periods.
This was initially scoped out of the MVP until checking with stakeholders, who raised the priority due to the potential sensitive nature of these types of mistake.
Influencing the roadmap.
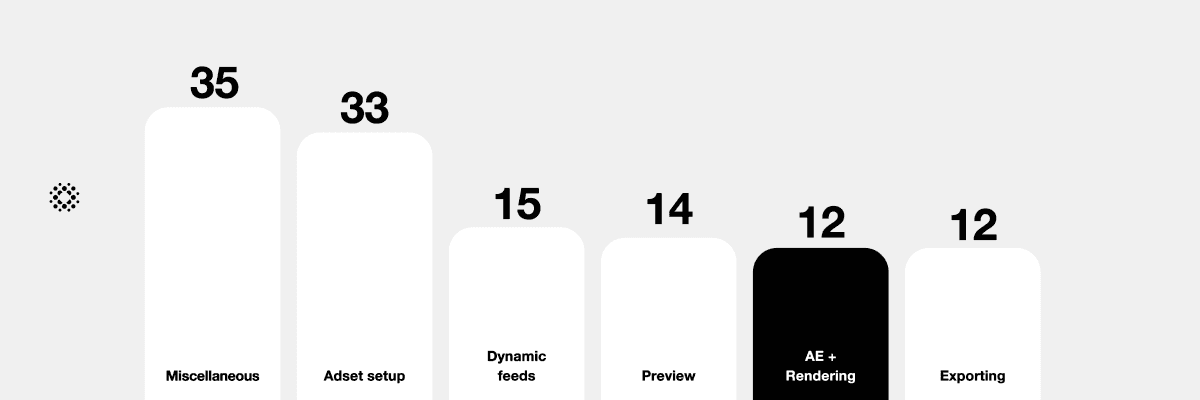
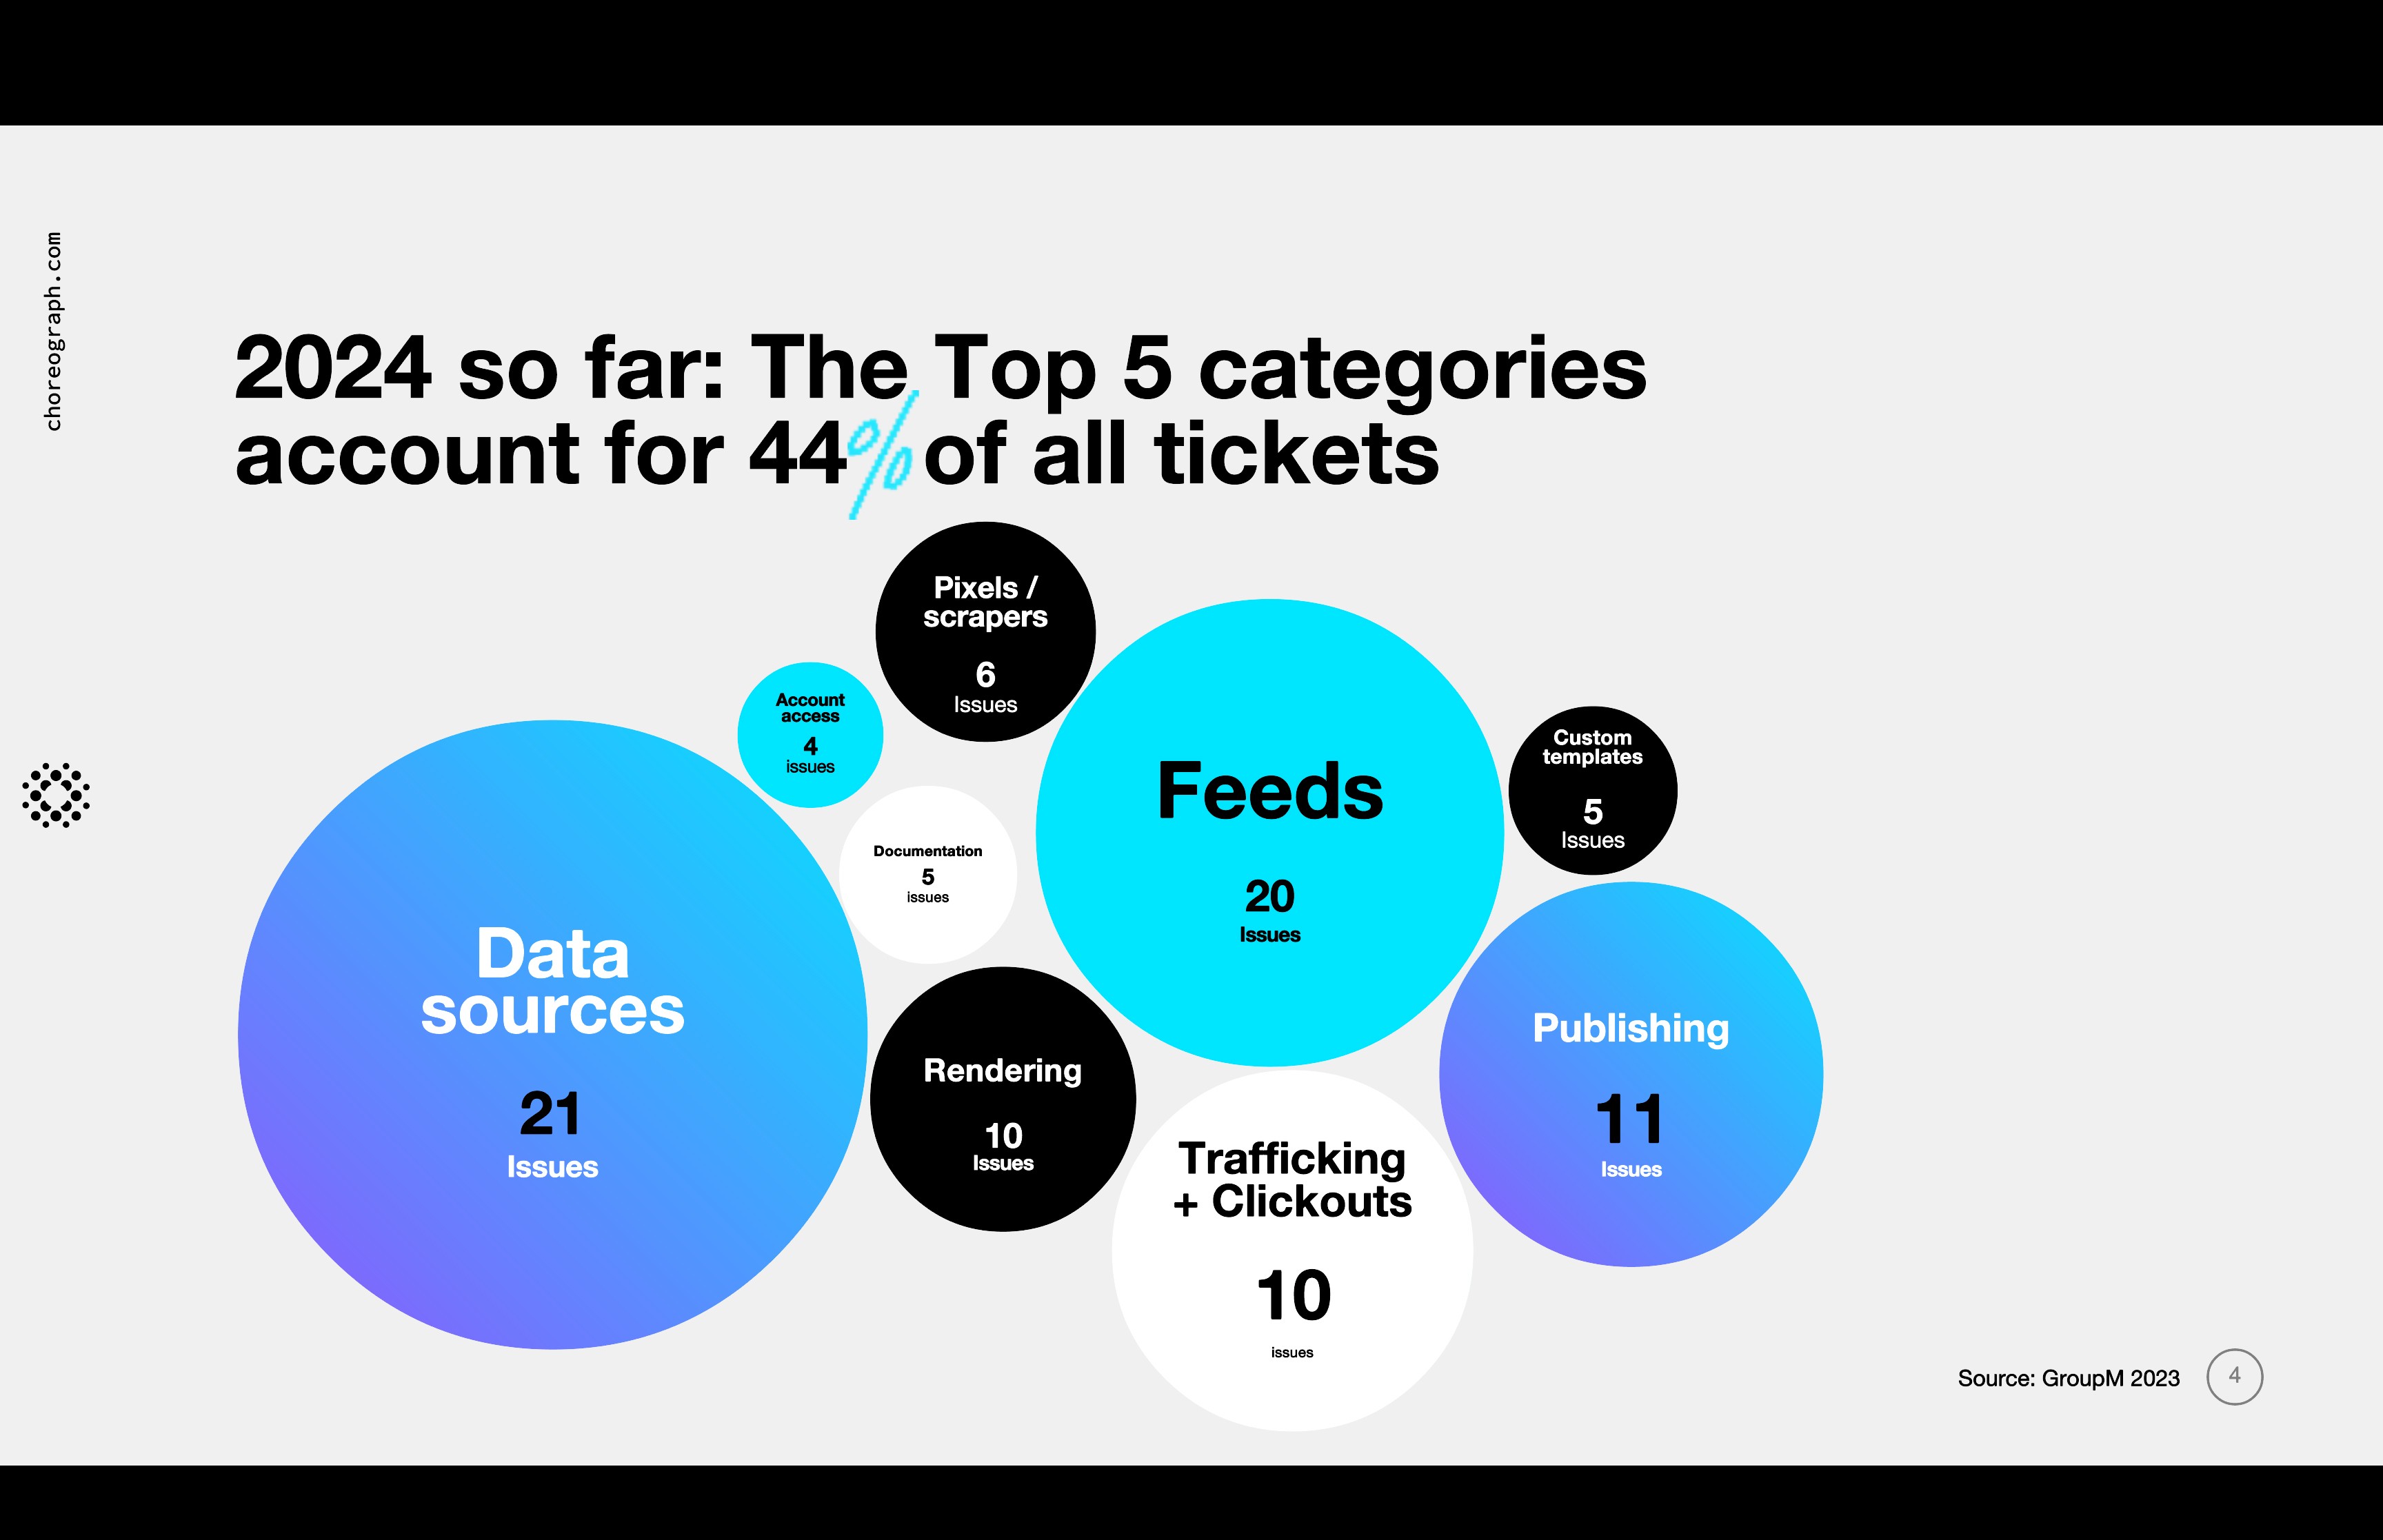
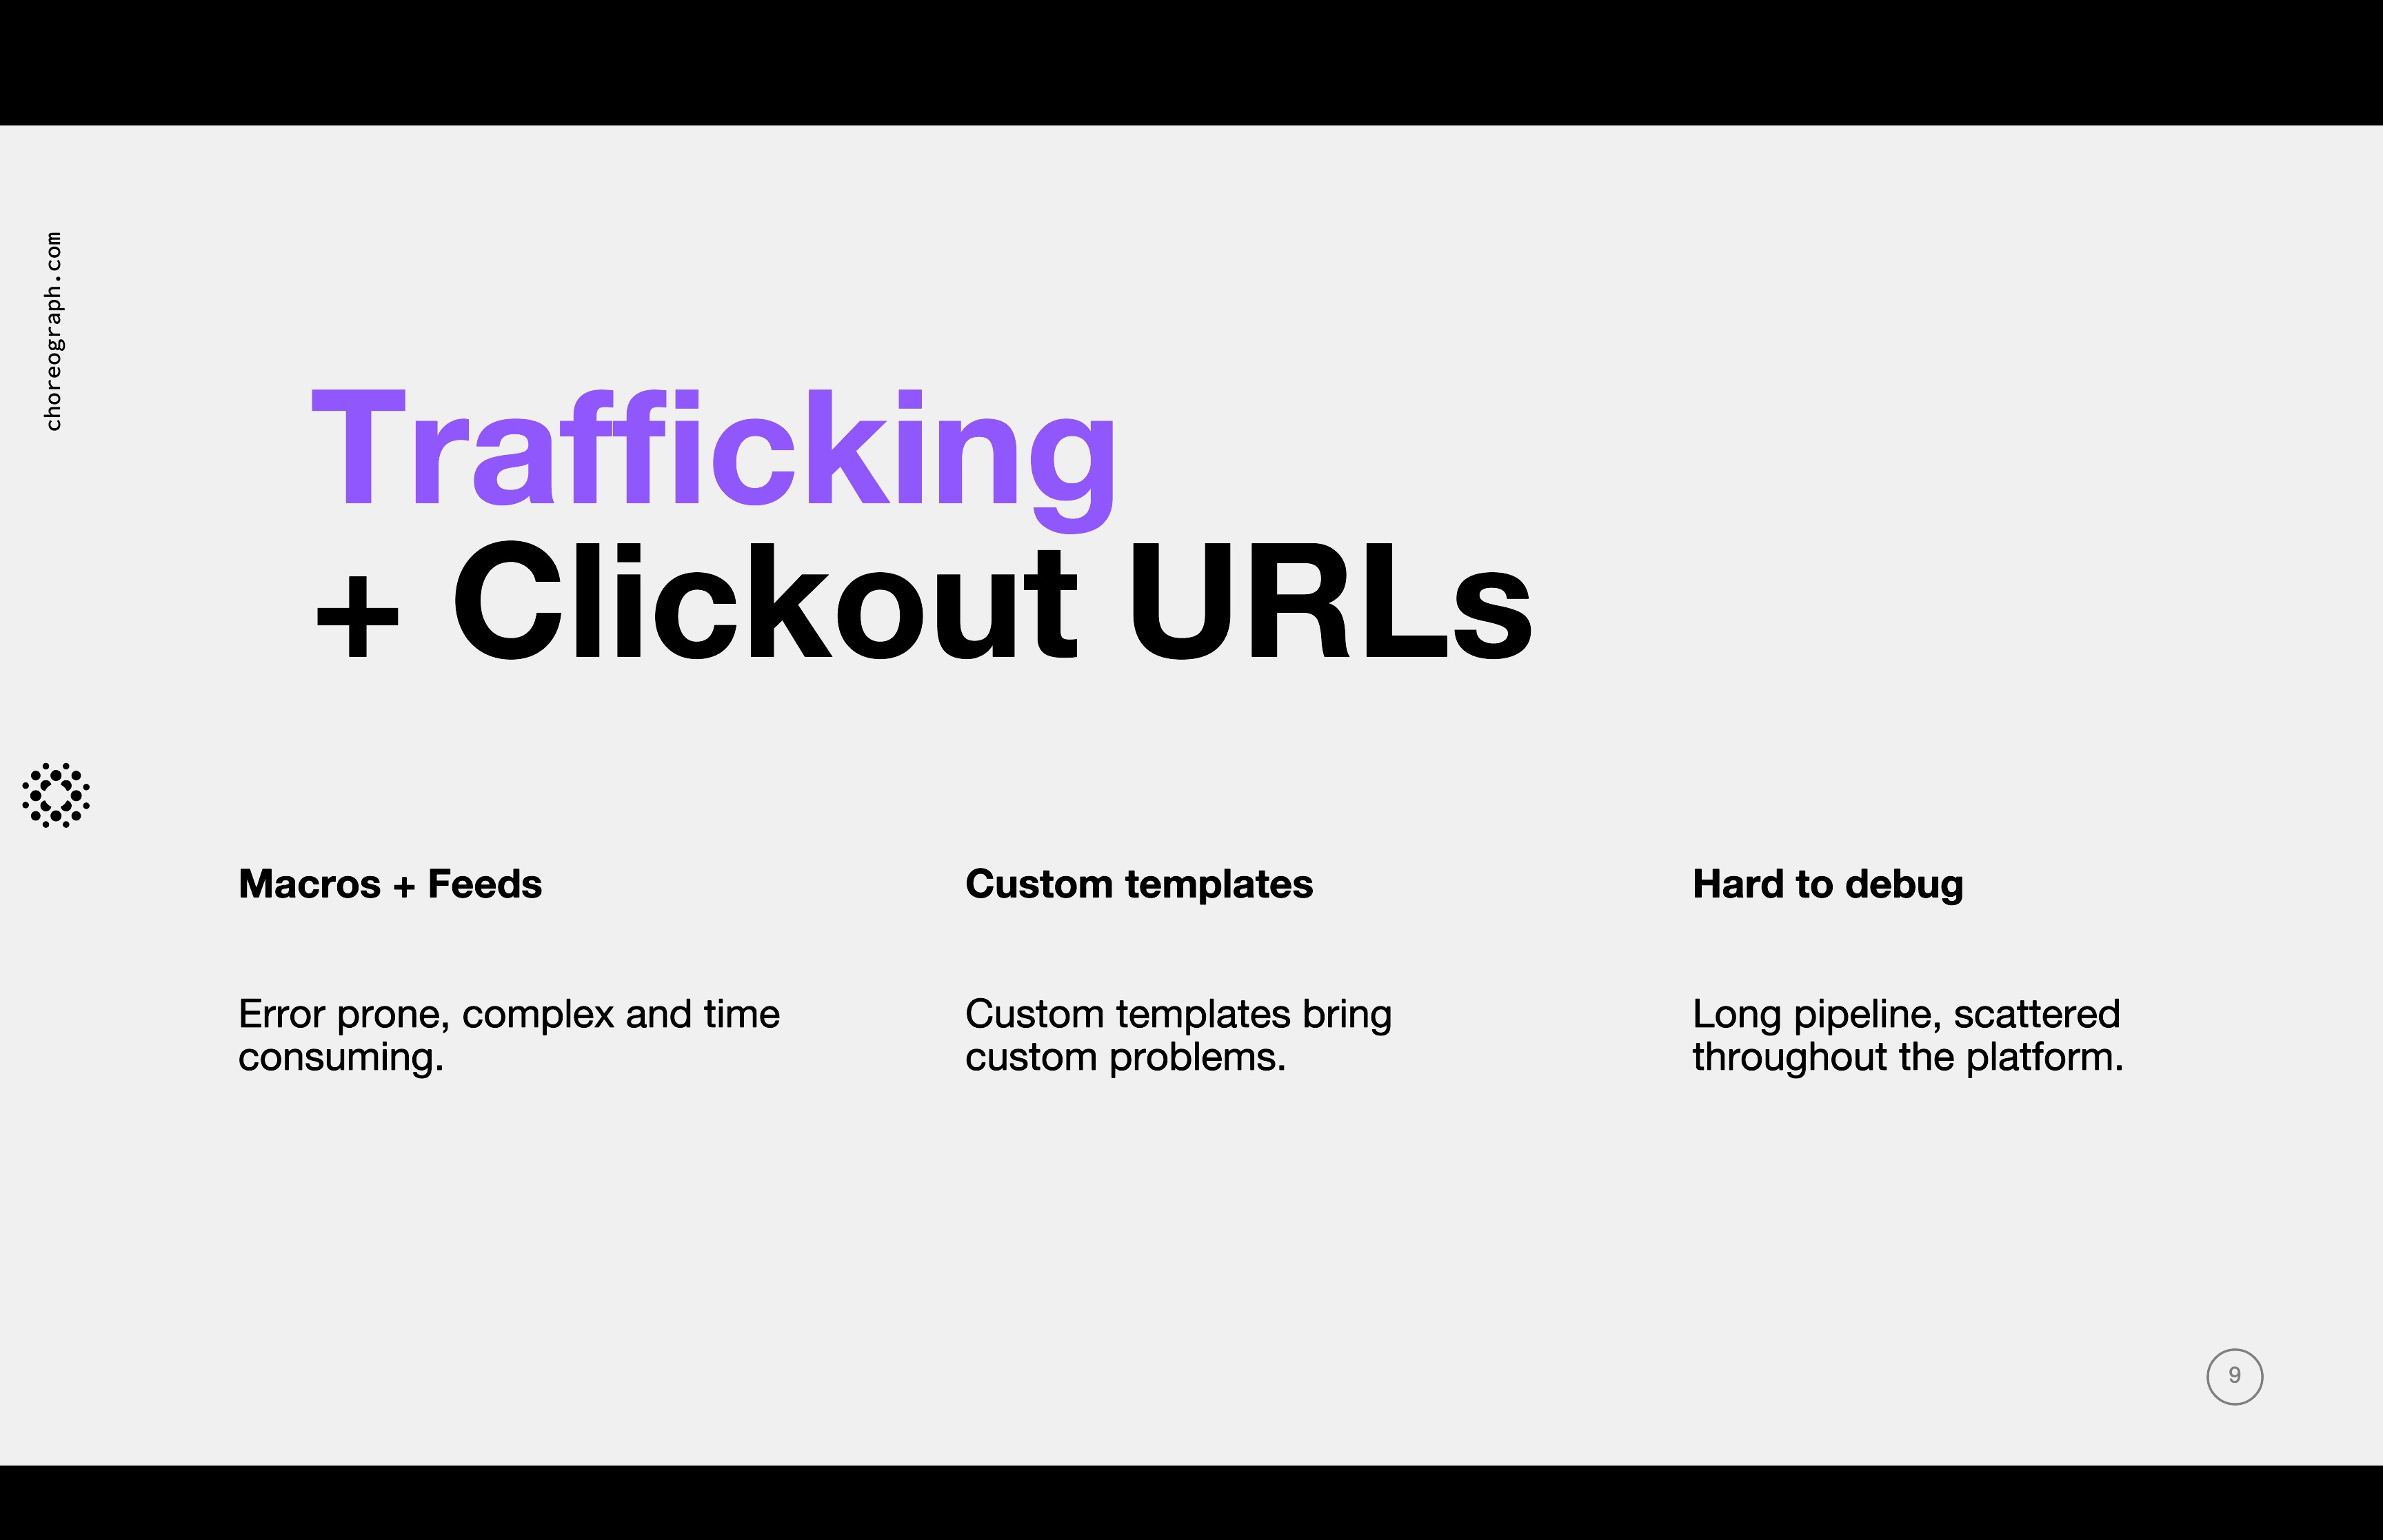
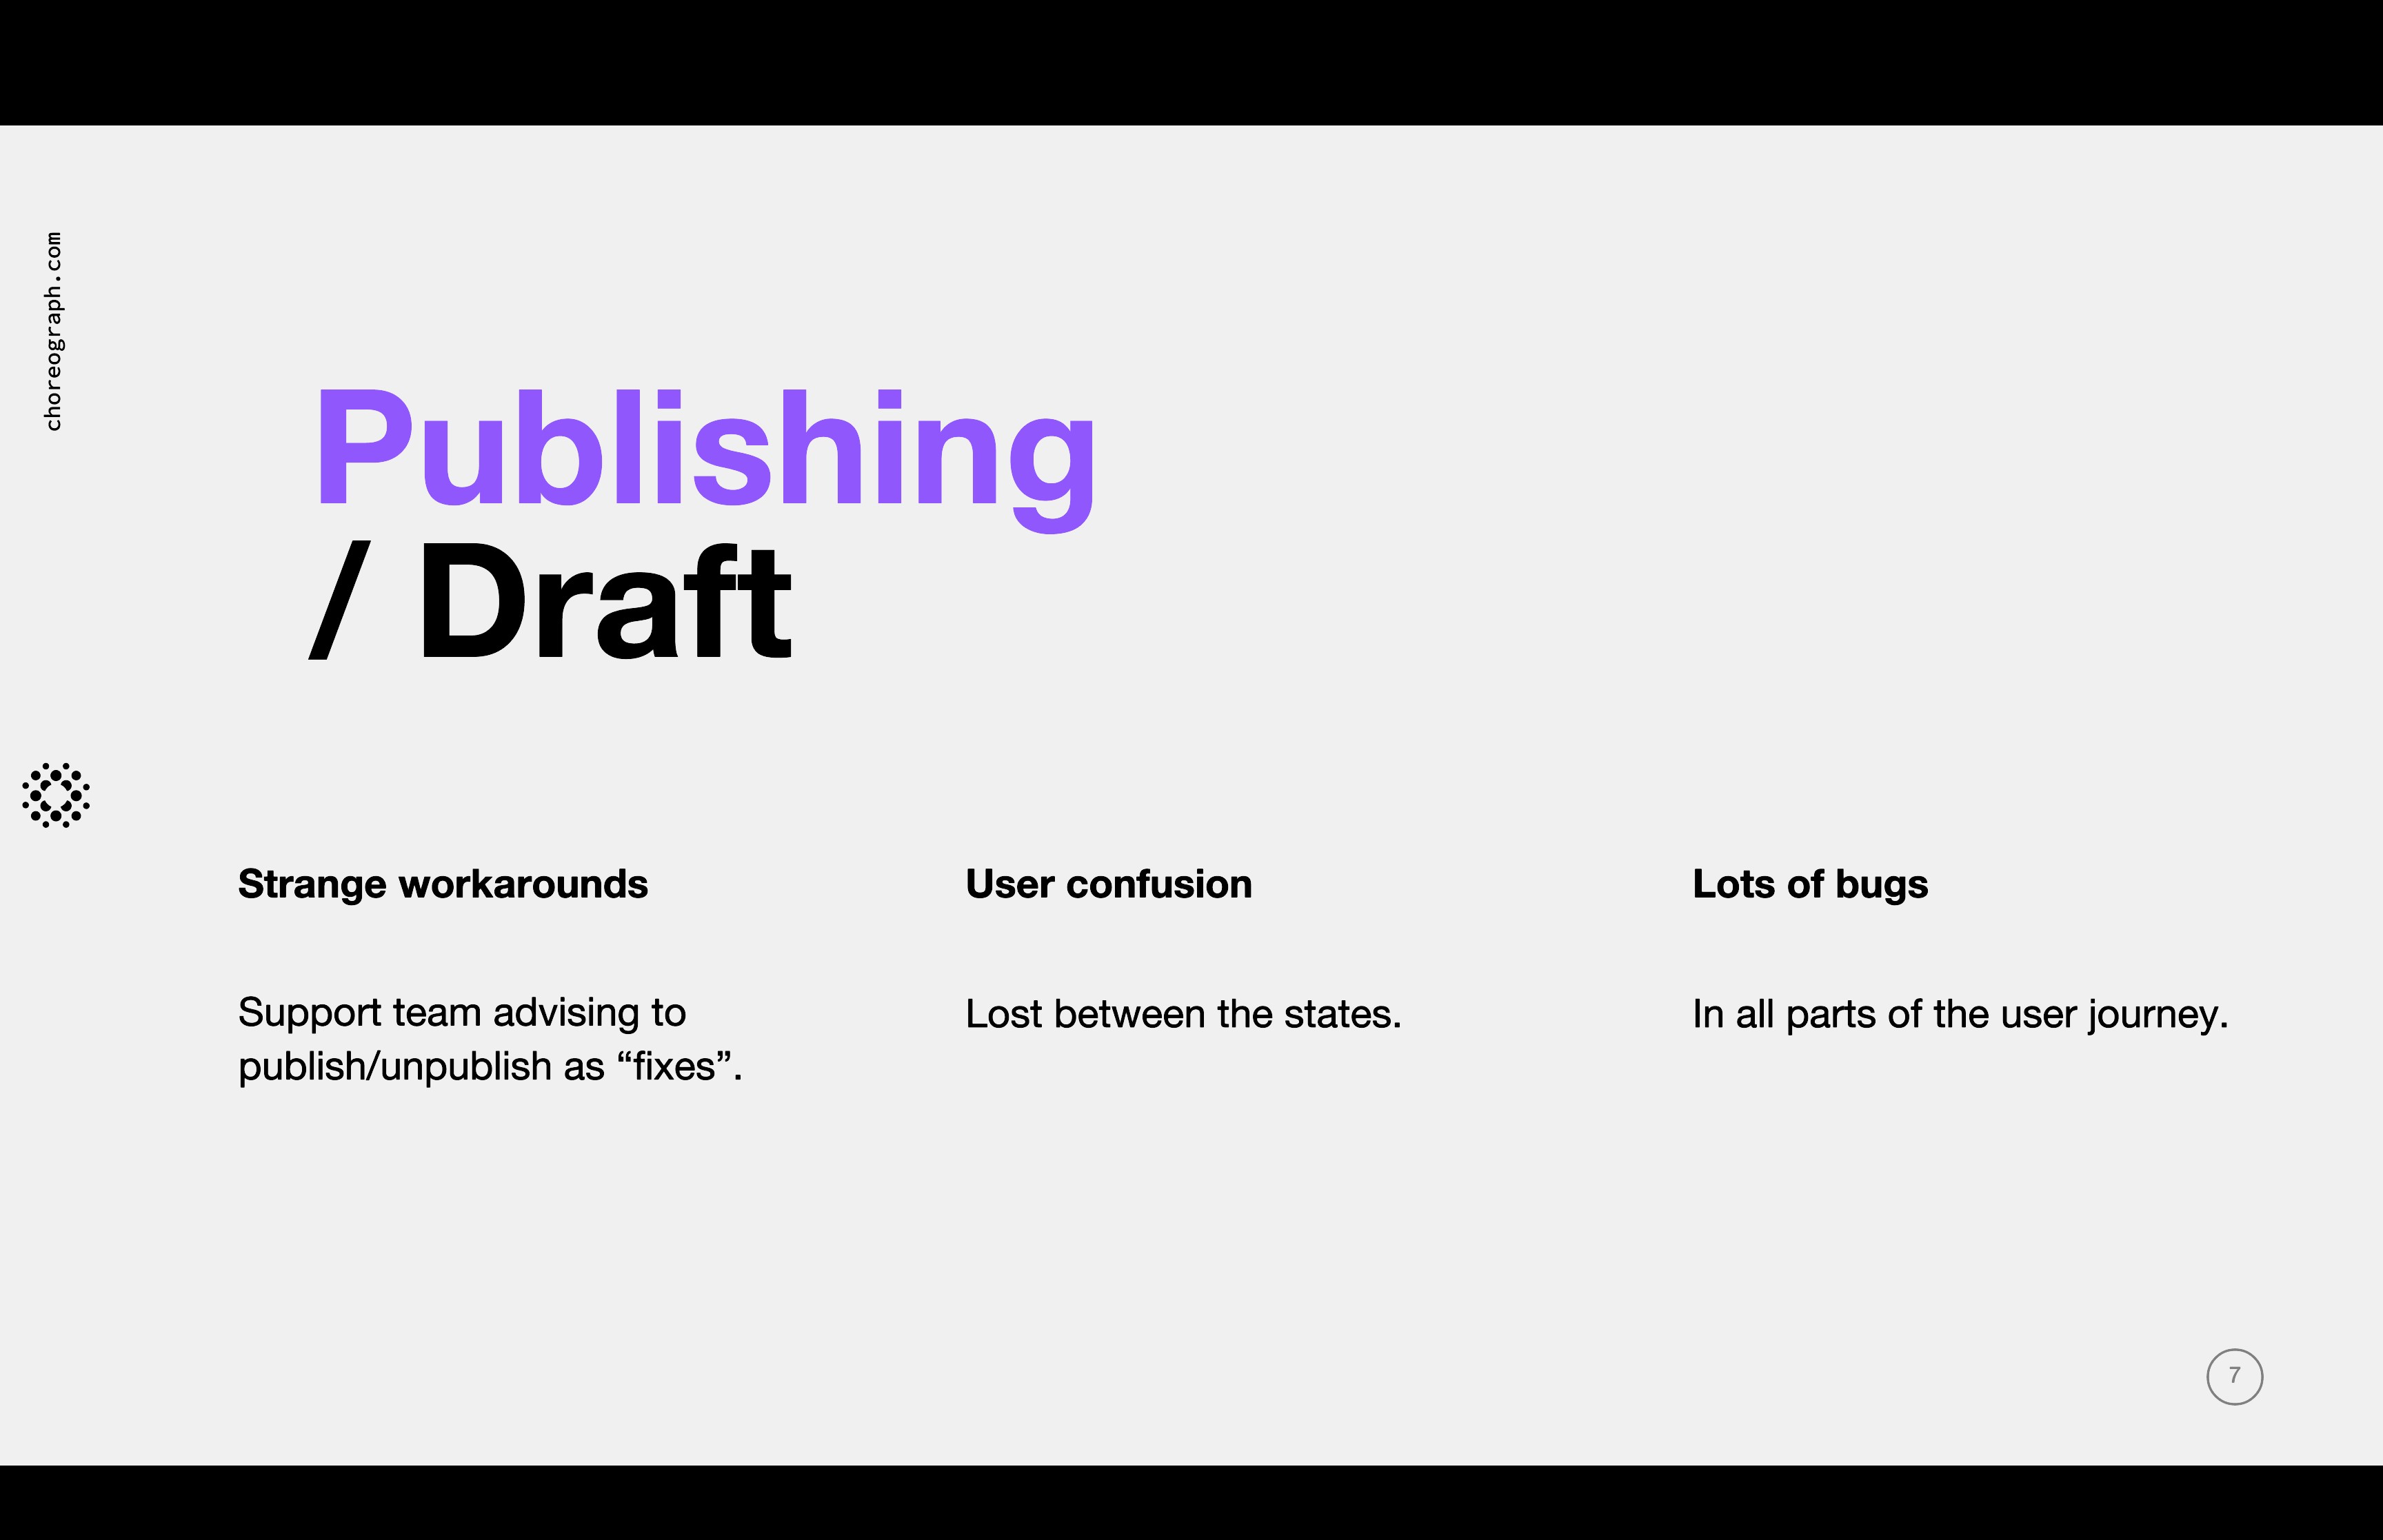
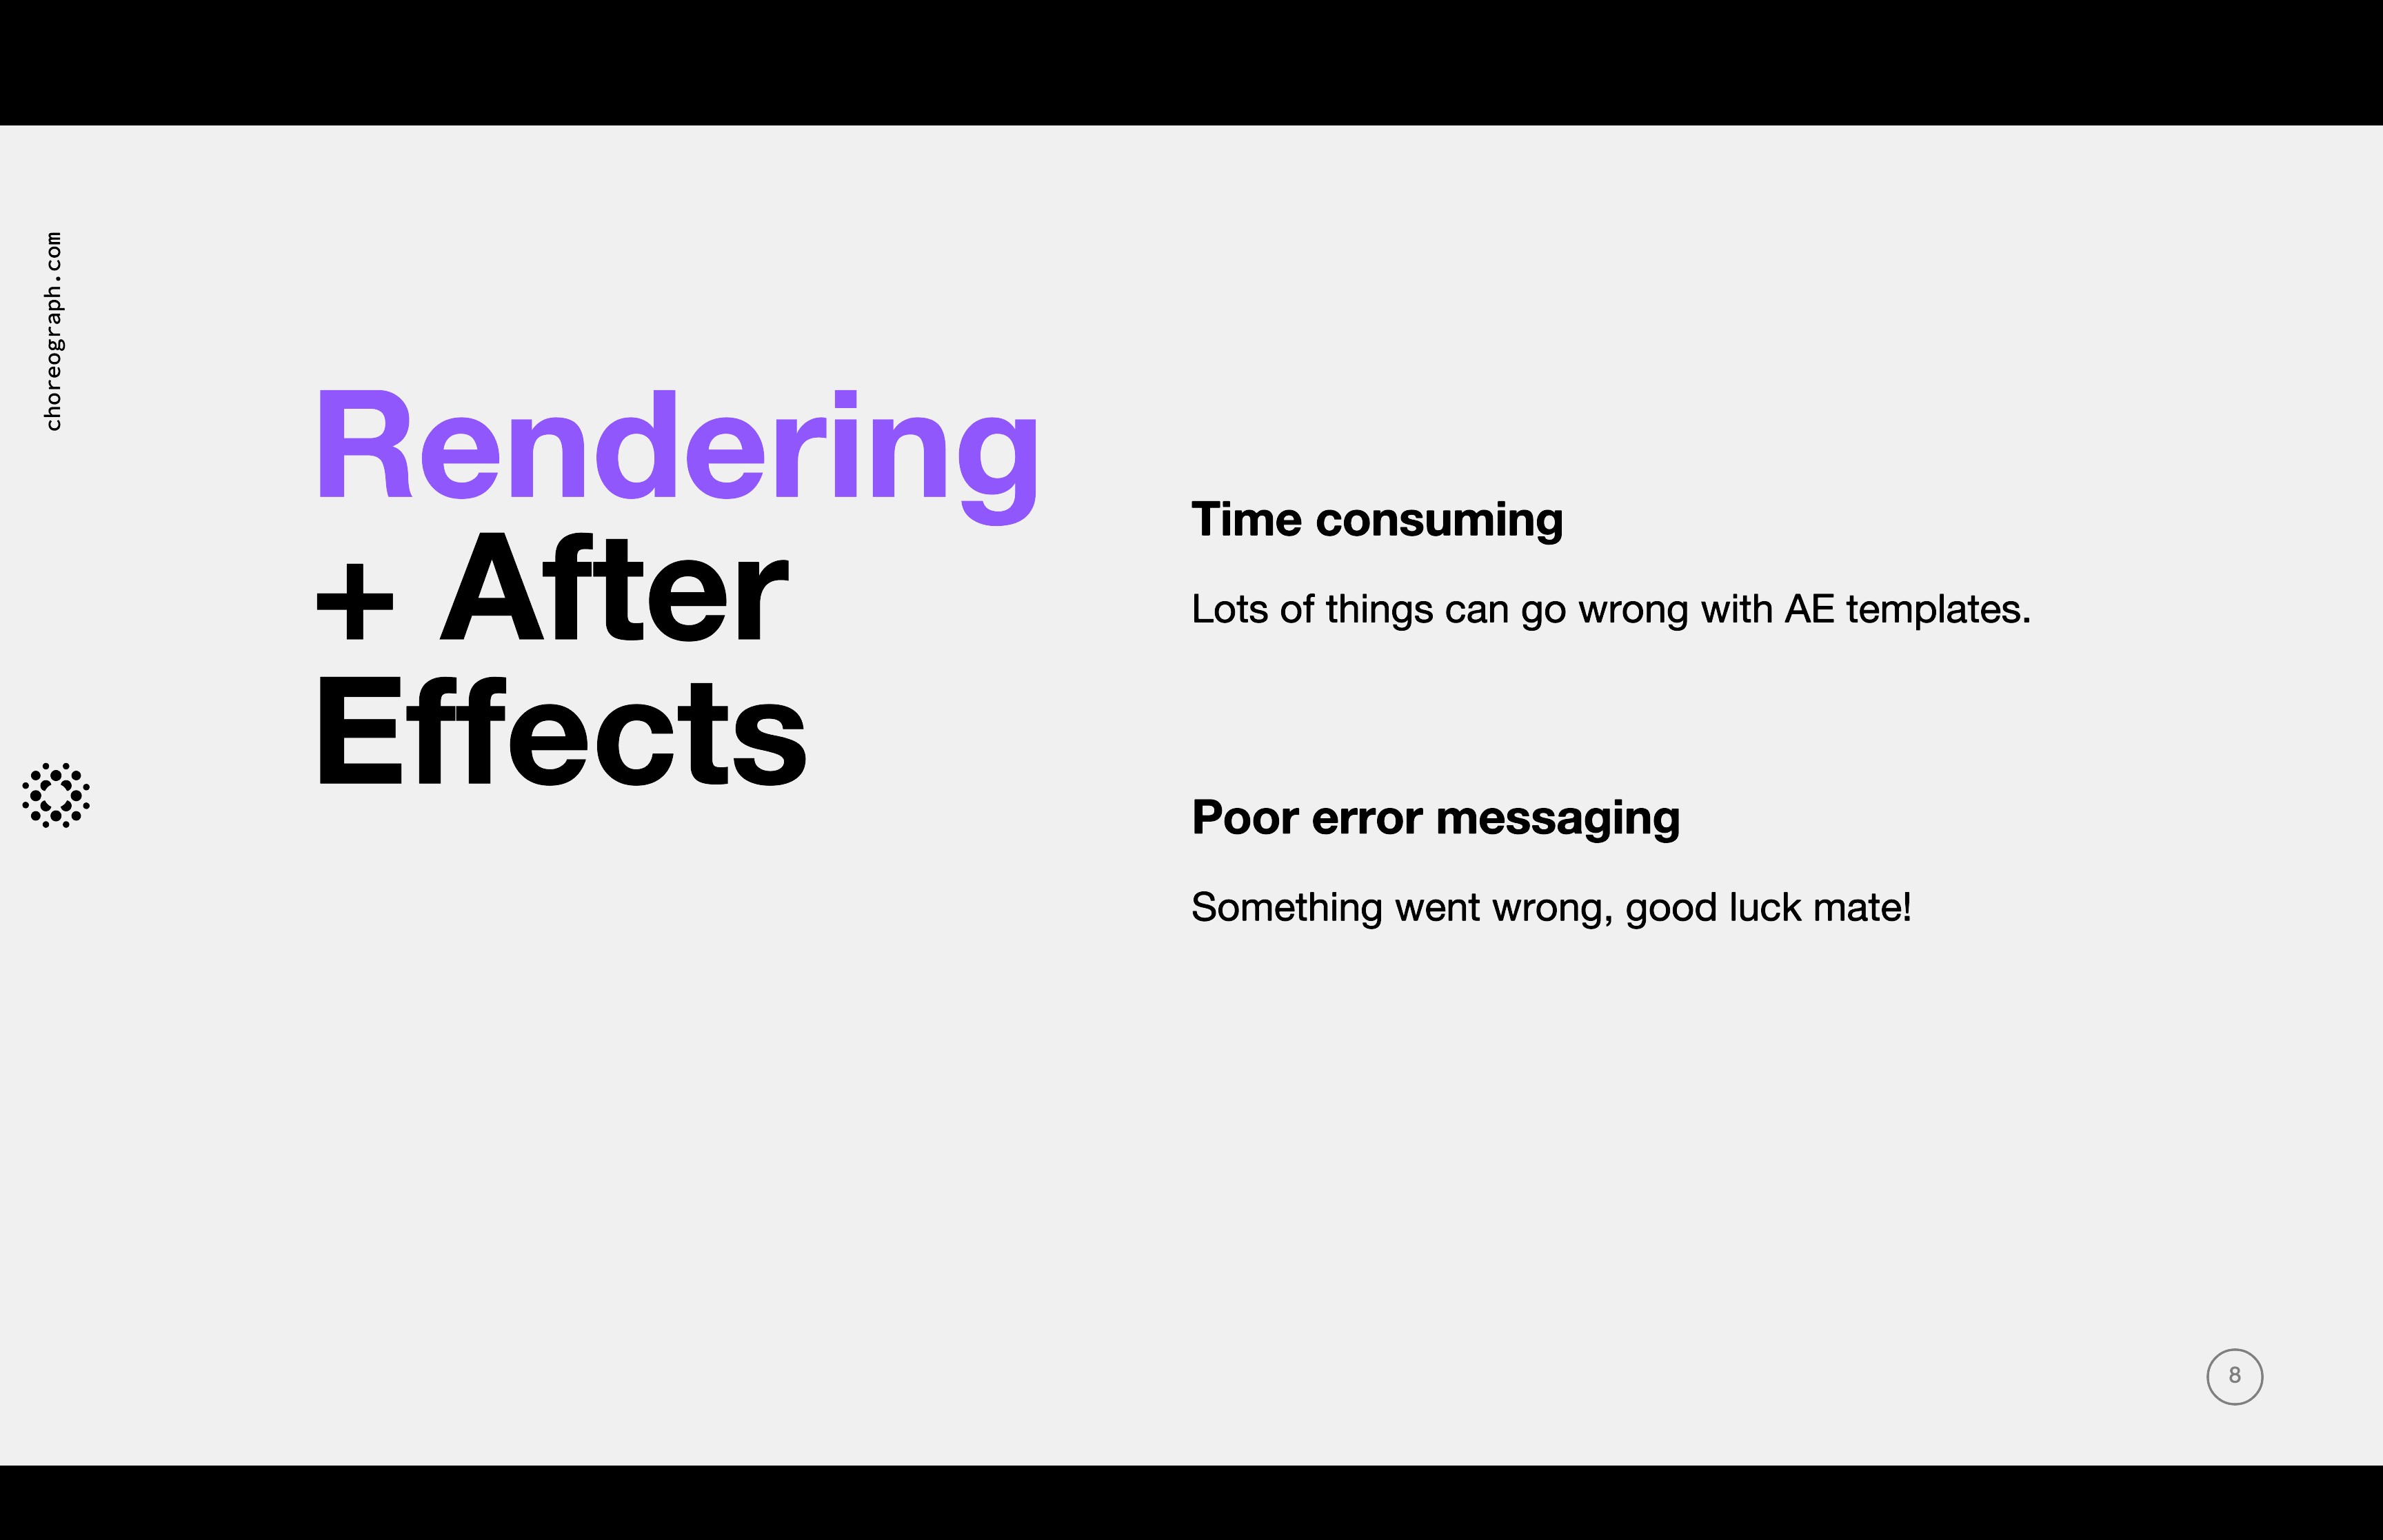
Every quarter I look at the dashboard and break down the top 10 categories in more detail. This is done on a Miro board where I label each ticket with their appropriate issues / subcategory. This method helps form the narrative around why the topic has so many associated tickets, what the problems are exactly and what the impact they have on our users - this helps build empathy within the product team.
This year I found that the top 5 categories were accounting for nearly half of all issues.
Something we want to improve on next year is to include the time to resolution on tickets, as many
This was initially scoped out of the MVP until checking with stakeholders, who raised the priority due to the potential sensitive nature of these types of mistake.